Erasmus+ in Figures
The data concerning the mobility activities carried out by the Ankara Science University Erasmus Coordination Office have been compiled on an academic-year basis to demonstrate the development of the Erasmus+ Programme at our University and the progress achieved in its internationalisation process.
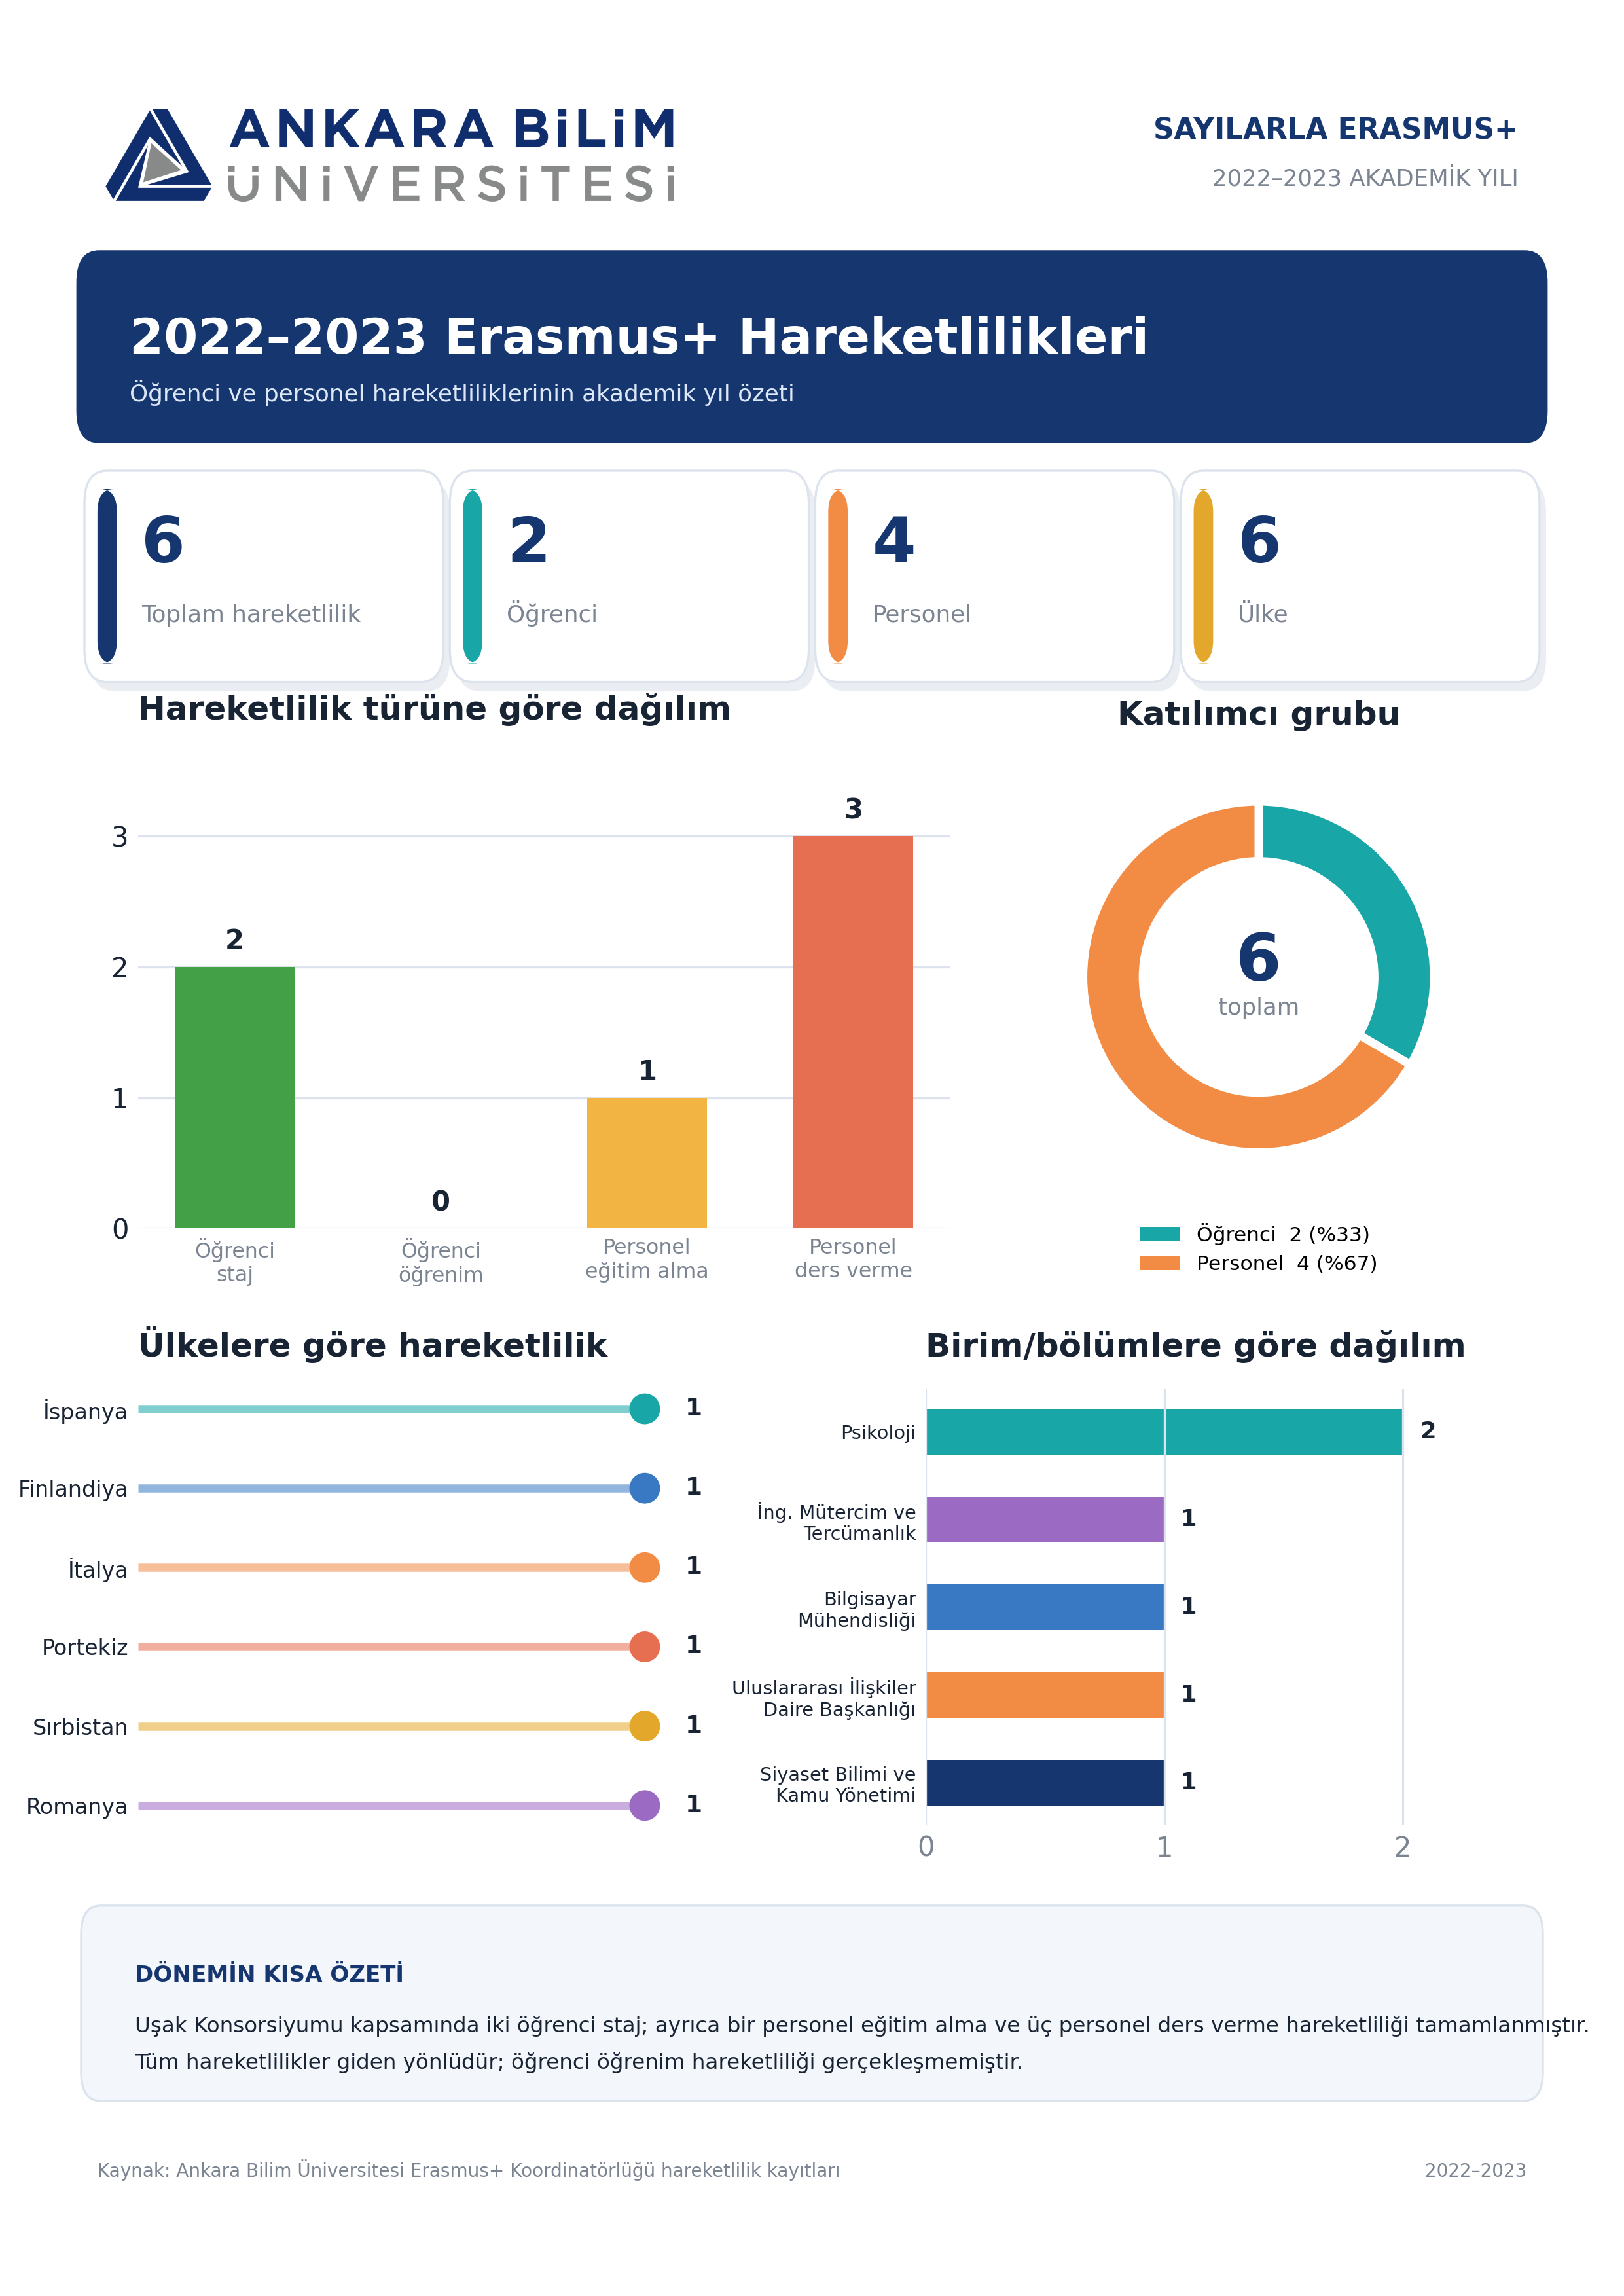
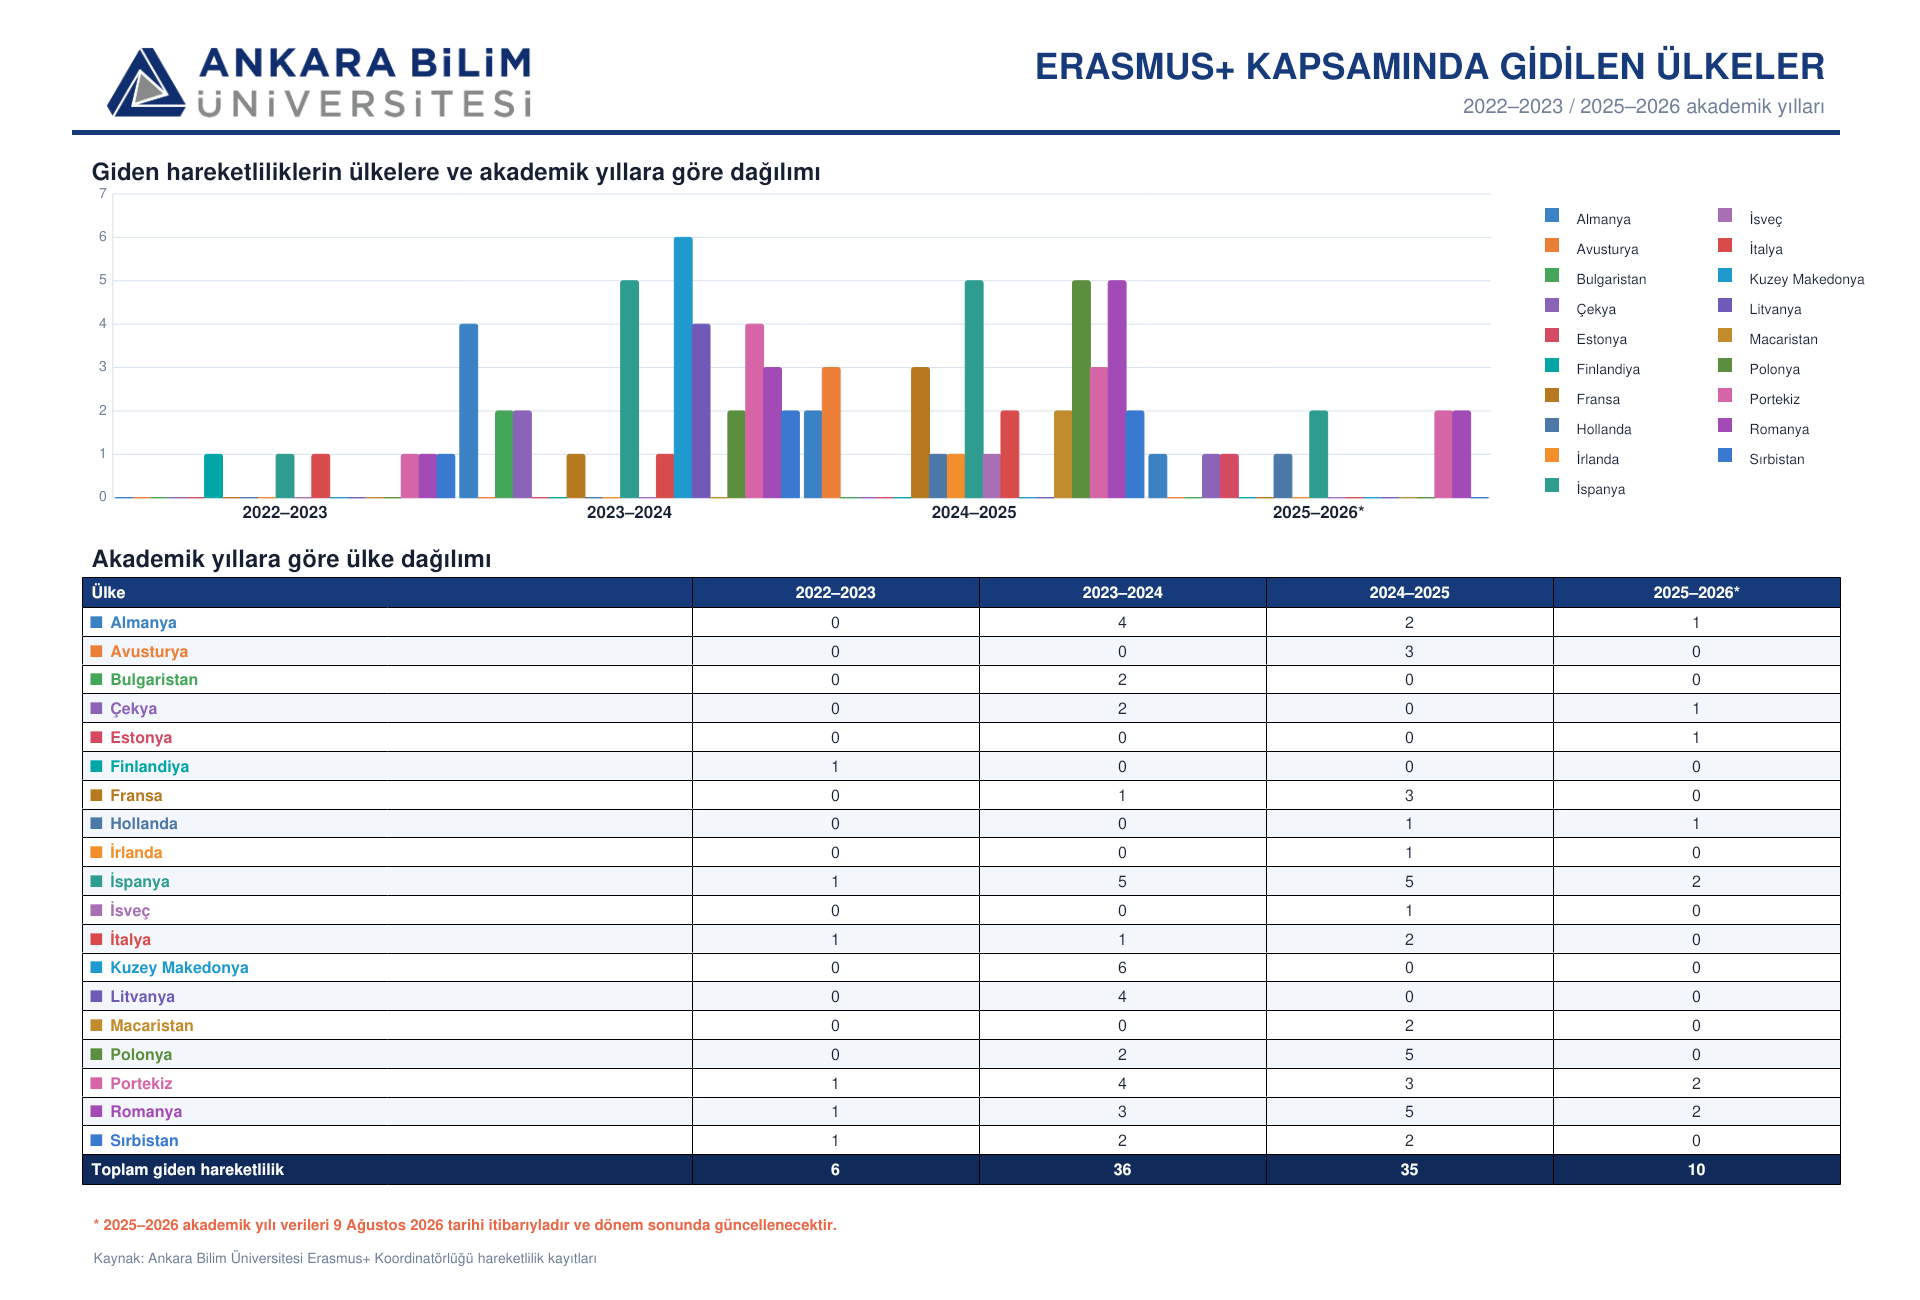
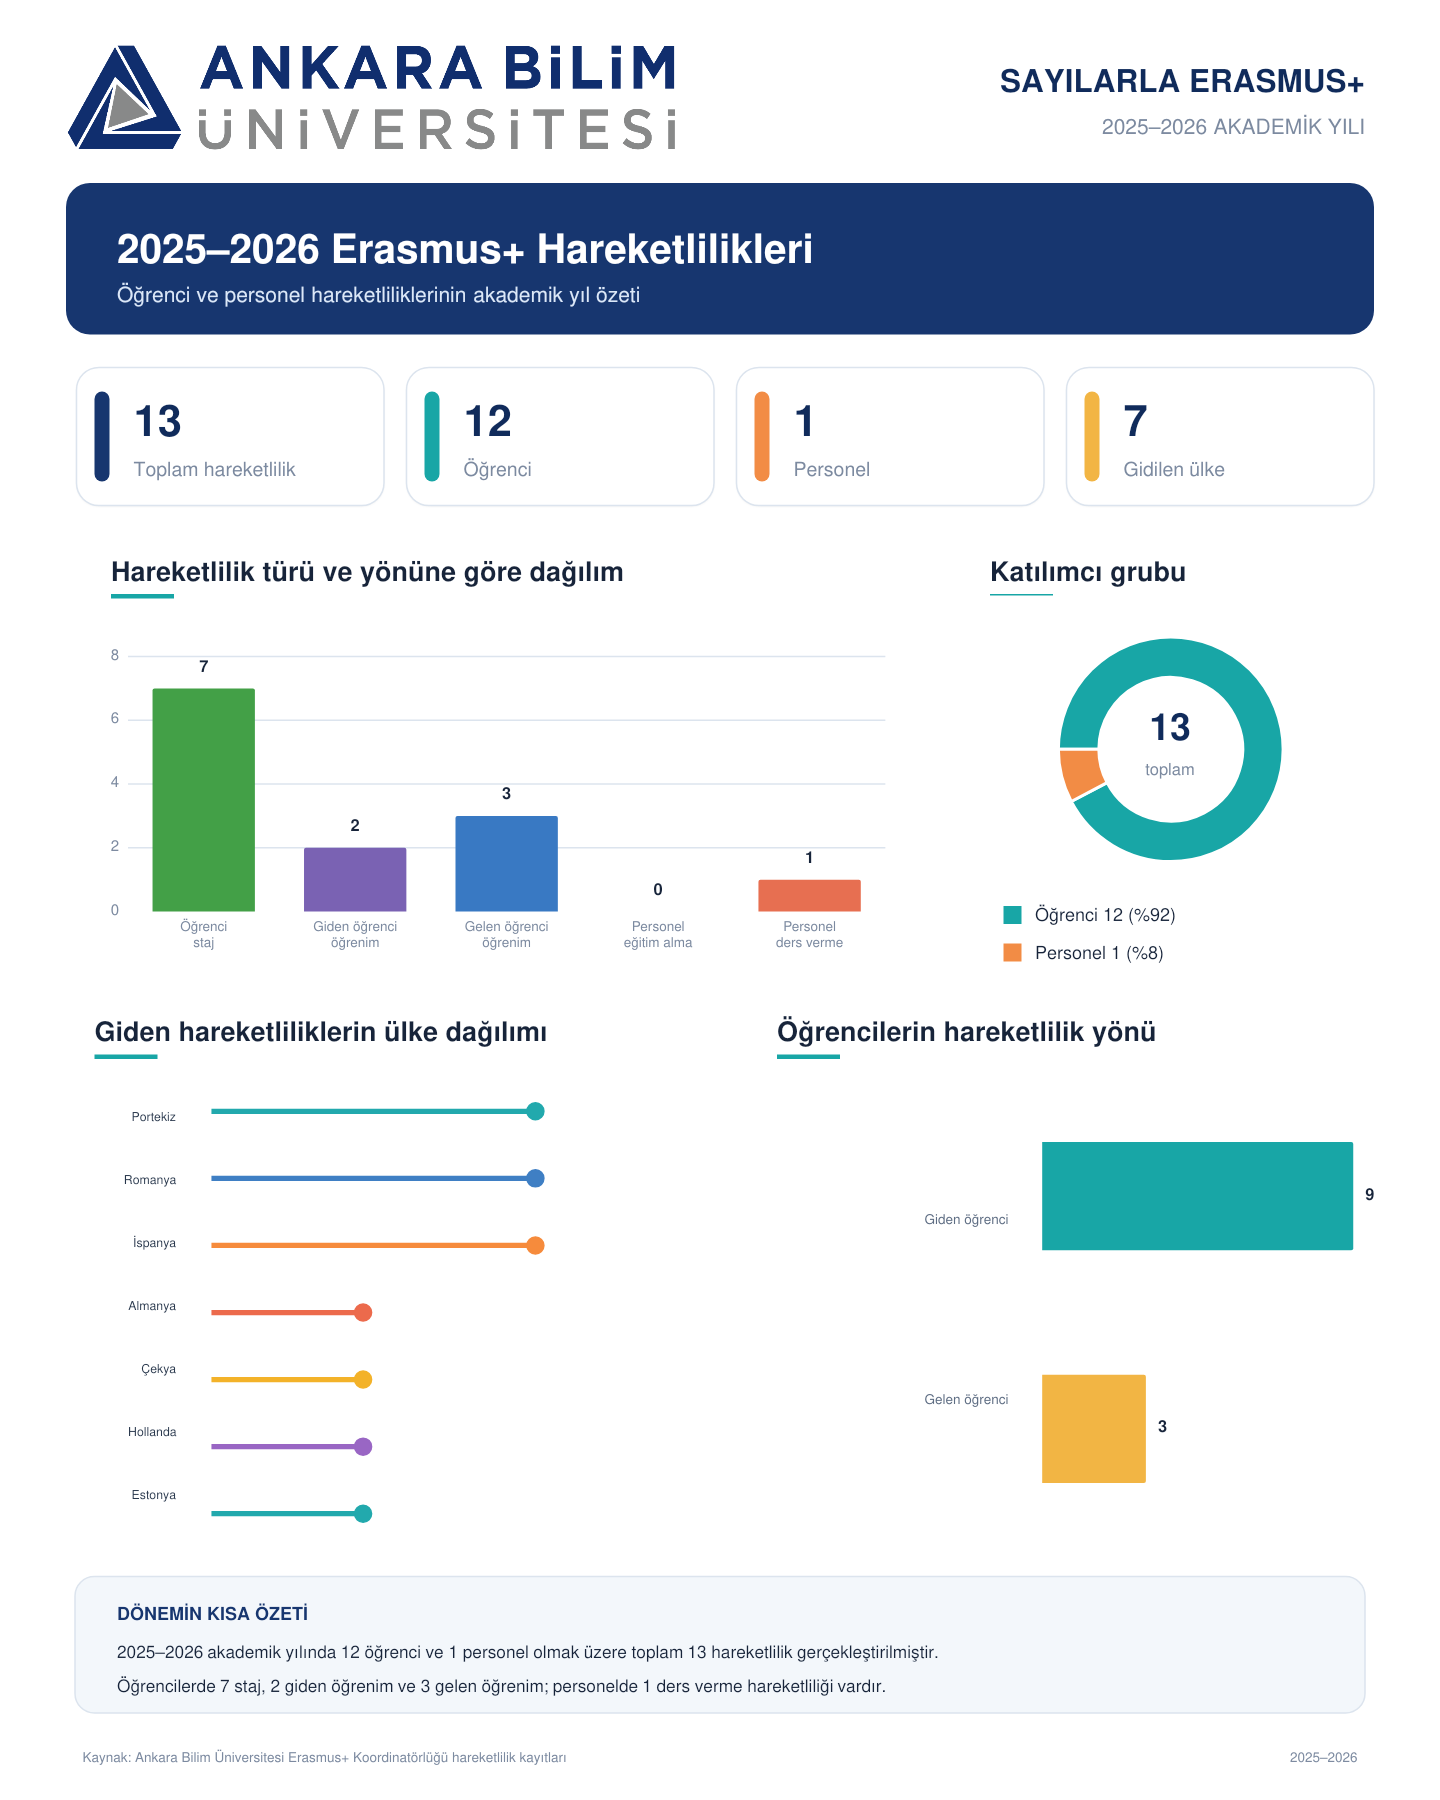
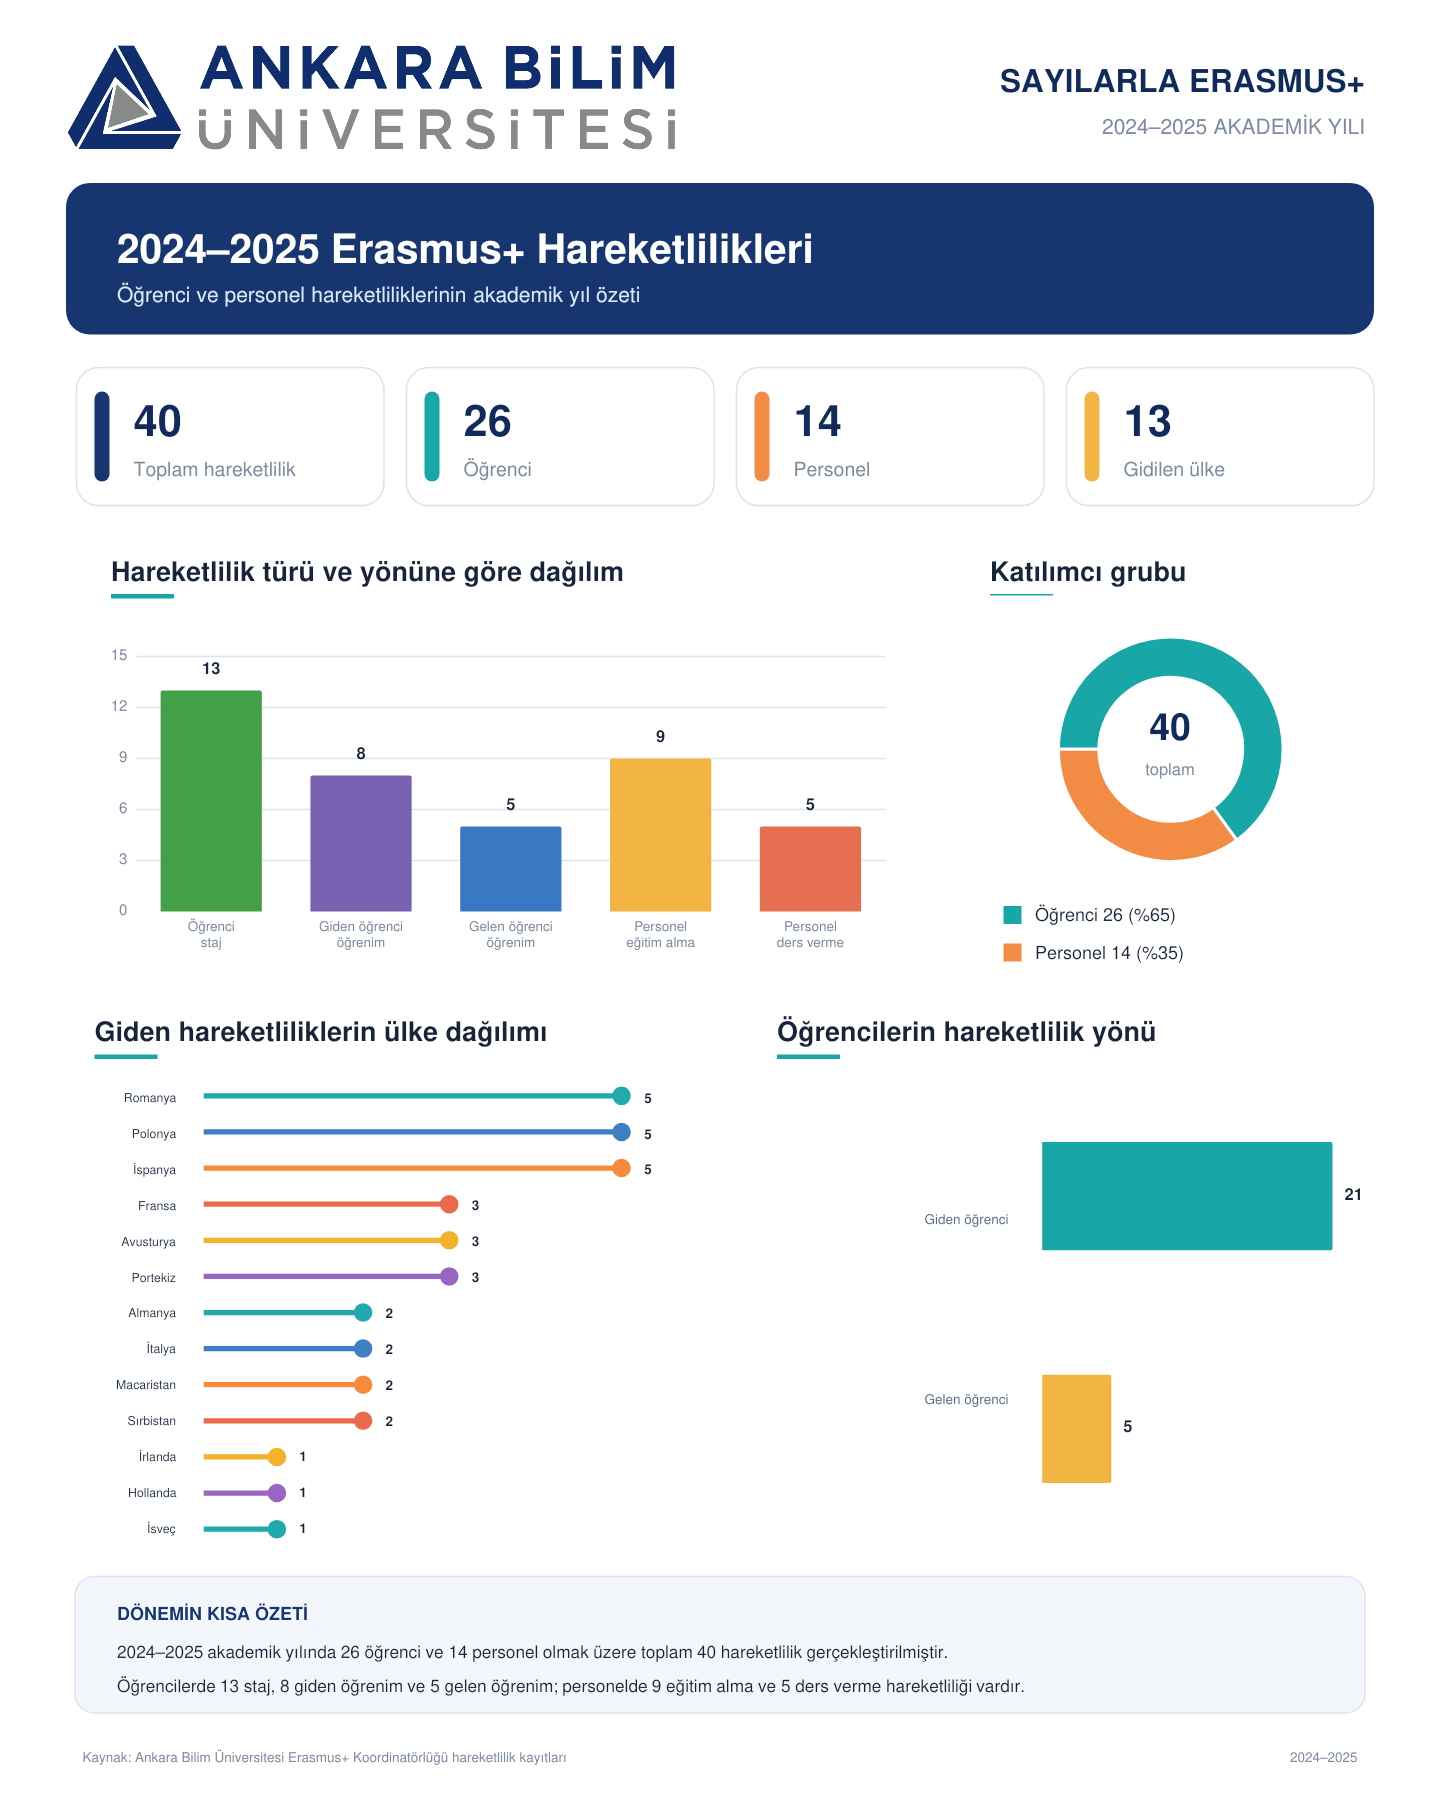
This page presents the total number of student and staff mobilities, their distribution by mobility type, the countries where the activities were carried out, and the academic units and departments of the participants.
The data have been prepared based on the official records of the Ankara Science University Erasmus Coordination Office to ensure that Erasmus+ activities are regularly monitored, evaluated and transparently shared with the public.
Please click here to view the General Erasmus+ Mobility Statistics visual.

Please click here to view the Erasmus+ Destination Countries visual.
Please click here to view the 2025–2026 Academic Year Erasmus+ Mobility Statistics visual.
Please click here to view the 2024–2025 Academic Year Erasmus+ Mobility Statistics visual.
Please click here to view the 2023–2024 Academic Year Erasmus+ Mobility Statistics visual.
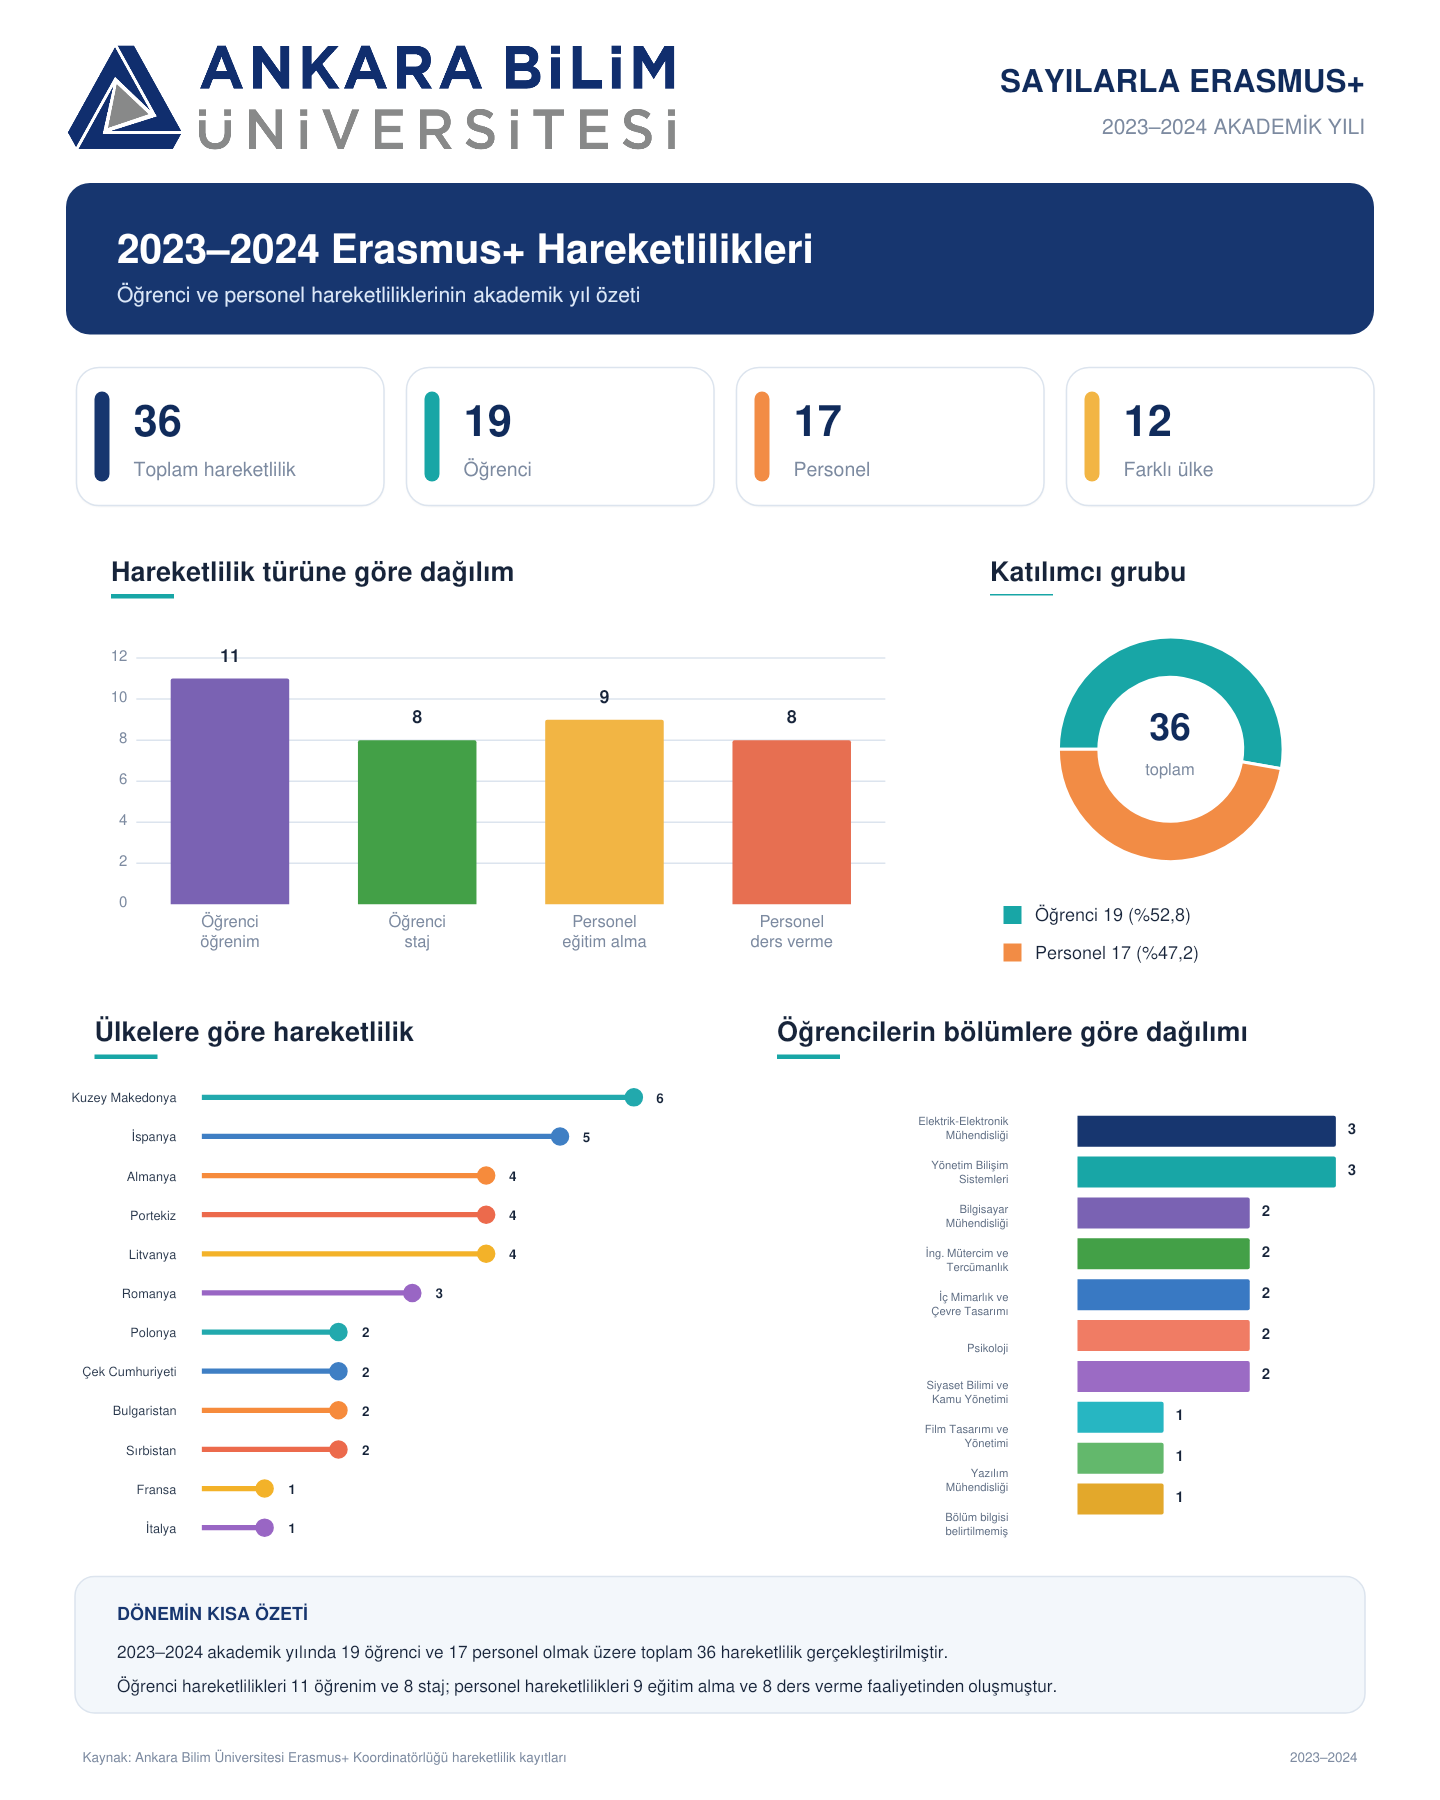
Please click here to view the 2022–2023 Academic Year Erasmus+ Mobility Statistics visual.